In the time since the lockdown started, the nation has experienced a severe drop in rents as people fled cities and a through-the-roof increase as offices reopened. Some residents that took advantage of low rents now find themselves priced out of the cities they’ve called home for the last two years. Many consider picking up their home offices and moving to a new, cheaper city.
But, what cities are the most and least expensive for renters? A key affordability indicator for a city is whether a resident making an average salary can afford an average apartment. Exactly how much salary do you need to rent an apartment in your city or one you desire?
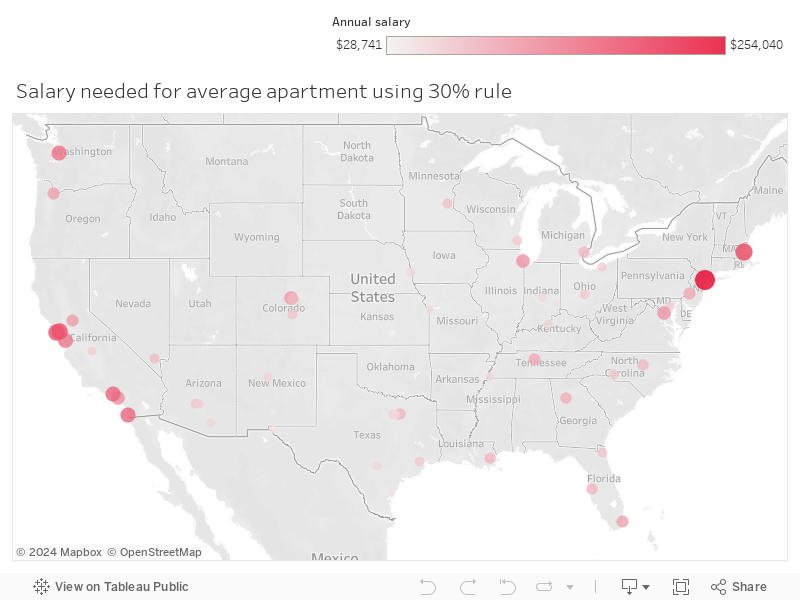
We studied the 50 largest cities in the U.S. and determined rent prices for an average one- and two-bedroom apartment in each. Using the widely-accepted rule that one should spend no more than 30 percent of their income on housing (i.e., rent), we calculated how much you would need to earn in each city to afford an average-priced apartment. From big triple-digit salaries in the Northeast to lower costs of living in the Midwest, we ranked each of the nation’s biggest cities on apartment affordability.
The cities where you need to earn the most to afford an average apartment
The cities where you need to earn the most to rent an average apartment are unsurprisingly along the coasts.
The two cities where you’ll need to earn the highest salary are New York City and Boston. Each of the next seven most expensive are on the West Coast, with six in California. Three of the eight highest are in the Bay Area and three of the top nine are in SoCal. Nine of the top 14 are West Coast cities.
Only six cities among the 20 with the highest rents are more than 100 miles from a coastline, with Chicago the lone non-coastal city to break the 10 priciest. Six of the top 50 lie in the Desert Southwest. Seven are in Texas. Every top city ranked lower than 22nd for the highest salary needed — and excepting only one (Jacksonville, FL) lower than 33rd — is away from a coast.
Apartment Guide looked at the average rent, dollar increase and year-over-year percent change among the top 50 most populated cities for a combination of one- and two-bedroom unit types. Below are several key takeaways from that data.
Takeaway No. 1: A third of the cities in the top 50 need a higher salary than the median household salary
The average median household salary, according to the U.S. Census Bureau, is $64,994 a year. Among the 50 largest cities, you’d need to make more than that in 60 percent of them to afford an average-priced apartment. There are eight cities where you would have to earn double that. Charlotte, NC, is just above the median, and Columbus, OH, is right below.
Among those cities above the median, six have increased in rents from this time last year and six have decreased. Just 11 of the top 50 largest cities enjoyed a decrease in year-to-year rent prices. Rents in Seattle increased the most from a year ago, up 45.21 percent and $1,125 a month. Baltimore rents decreased the most, down 18.81 percent and $359 a month. Santa Ana, CA, was the lone city among the top 14 highest salaries needed that saw a yearly decrease, down 1.70 percent and $52.
Takeaway No. 2: Cities with the highest populations don’t necessarily have the highest salaries needed to rent
Just half of the top 10 largest cities are also among the top 10 cities where you need to earn the most to rent. But, it does still help to live further from the ocean. New York, of course, is both the most populous city and the most expensive. Los Angeles is the second-largest but fifth-priciest. Third-biggest Chicago is the 10th-highest income needed.
San Antonio, as many don’t realize, is the nation’s seventh largest city. But, sitting deep in the heart of Texas, it ranks 42nd in income needed to afford an average apartment. Midwest Indianapolis is the 16th-biggest but 45th-priciest.
Santa Ana and Oakland, CA, are both among the lowest populated cities in the top 50. But, that doesn’t mean renters are getting good deals. Oakland ranks 41st in population but required the third highest income to rent an average apartment. Santa Ana is just the 49th largest city, but you’d need the ninth-biggest income to rent on average.
Similarly, the city where you need the second-highest income is Boston, just the 20th-largest city. San Francisco is an expensive fourth, with just the 17th most residents.
Takeaway No. 3: The divide between the most and least expensive cities to rent is stark and requires very different salaries
New York City is the only city in the nation where you need to make over $200,000 a year to rent an average apartment. That’s over $66,000 more income needed than second-place Boston.
The average rent in the Big Apple is $6,351 a month, over $1,600 more a month than Beantown at No. 2, with 12 times the population. New York saw an increase of 20.73 percent over last year’s rents, the 10th most of the top 50. That’s an increase of $1,091 each month.
On the flip side is Wichita, KS. The so-called Air Capital of the World has the cheapest rents of not just the top 50 largest cities, but of any city with a population over 50,000. It’s the only city among the top 50 biggest where you don’t need to earn more than $40,000 a year to afford an average apartment. In fact, you don’t even need to earn $30,000. A yearly salary of just $28,741 will afford you an average rent. That’s $15,270 less per year needed to make than second-cheapest El Paso, TX.
However, not all is golden in Wichita. Even that close to the middle of the country, residents aren’t immune to inflation. Rents in Wichita, averaging just $719 a month, actually rose 24.74 percent from this time last year. The seventh-highest increase among the top 50 largest cities, monthly rents shot up $143 year to year.
How much salary do you need to rent an apartment in the 50 largest cities
It’s pretty simple to see the divide. The cities that require the highest salaries to rent an average apartment cluster in the Northeast and California. Meanwhile, the cities among the top 50 most populous that require lower yearly incomes cut a swath from the Ohio Valley through Texas to the Arizona desert.
So, how much salary do you need to rent an apartment in the city right for you? Check out the full list of all 50 largest cities and research available units and detailed rental prices at Apartment Guide.
| City | Population | Average Rent, All Units | Average Rent YoY Change | Salary Needed w/ 30% Rule |
|---|---|---|---|---|
| New York, NY | 8,336,817 | $6,351 | 20.73% | $254,040 |
| Boston, MA | 692,600 | $4,700 | 10.78% | $188,009 |
| Oakland, CA | 433,031 | $4,430 | 3.36% | $177,204 |
| San Francisco, CA | 881,549 | $4,336 | 7.61% | $173,443 |
| Los Angeles, CA | 3,979,576 | $3,952 | 0.13% | $158,064 |
| San Diego, CA | 1,423,851 | $3,913 | 7.07% | $156,506 |
| Seattle, WA | 753,675 | $3,614 | 45.21% | $144,549 |
| San Jose, CA | 1,021,795 | $3,517 | 22.77% | $140,667 |
| Santa Ana, CA | 332,318 | $2,988 | -1.70% | $119,539 |
| Chicago, IL | 2,693,976 | $2,947 | 11.95% | $117,891 |
| Washington, DC | 705,749 | $2,830 | 11.31% | $113,181 |
| Denver, CO | 727,211 | $2,763 | 8.51% | $110,505 |
| Sacramento, CA | 513,624 | $2,631 | 14.16% | $105,248 |
| Portland, OR | 654,741 | $2,529 | 13.91% | $101,171 |
| Miami, FL | 467,963 | $2,507 | -14.14% | $100,285 |
| Nashville, TN | 670,820 | $2,370 | -5.40% | $94,785 |
| Philadelphia, PA | 1,584,064 | $2,347 | 11.79% | $93,878 |
| Atlanta, GA | 506,811 | $2,215 | 16.62% | $88,599 |
| New Orleans, LA | 390,144 | $2,112 | -1.34% | $84,461 |
| Dallas, TX | 1,343,573 | $2,091 | 12.34% | $83,625 |
| Tampa, FL | 399,700 | $2,030 | 20.63% | $81,215 |
| Aurora, CO | 379,289 | $1,989 | -6.22% | $79,578 |
| Detroit, MI | 670,031 | $1,956 | 4.49% | $78,256 |
| Raleigh, NC | 474,069 | $1,953 | 40.77% | $78,106 |
| Las Vegas, NV | 651,319 | $1,915 | 6.58% | $76,618 |
| Minneapolis, MN | 429,606 | $1,805 | 5.84% | $72,217 |
| Phoenix, AZ | 1,680,992 | $1,732 | 32.29% | $69,294 |
| Jacksonville, FL | 911,507 | $1,722 | -2.12% | $68,871 |
| Colorado Springs, CO | 478,221 | $1,701 | 31.99% | $68,035 |
| Charlotte, NC | 885,708 | $1,646 | 7.76% | $65,857 |
| Columbus, OH | 898,553 | $1,617 | 15.76% | $64,683 |
| Houston, TX | 2,320,268 | $1,598 | 8.92% | $63,917 |
| Milwaukee, WI | 590,157 | $1,595 | 1.51% | $63,818 |
| Cleveland, OH | 381,009 | $1,574 | -4.76% | $62,973 |
| Baltimore, MD | 593,490 | $1,550 | -18.81% | $62,009 |
| Mesa, AZ | 518,012 | $1,534 | 12.84% | $61,360 |
| Fresno, CA | 531,576 | $1,514 | -1.47% | $60,569 |
| Albuquerque, NM | 560,513 | $1,429 | 16.76% | $57,166 |
| Fort Worth, TX | 909,585 | $1,425 | 12.67% | $57,008 |
| Louisville, KY | 617,638 | $1,408 | 18.58% | $56,327 |
| Omaha, NE | 478,192 | $1,339 | 14.67% | $53,554 |
| San Antonio, TX | 1,547,253 | $1,337 | 25.20% | $53,461 |
| Tucson, AZ | 548,073 | $1,332 | 24.43% | $53,299 |
| Memphis, TN | 651,073 | $1,316 | 25.95% | $52,627 |
| Indianapolis, IN | 876,384 | $1,301 | 5.27% | $52,059 |
| Kansas City, MO | 495,327 | $1,286 | -10.00% | $51,437 |
| Arlington, TX | 398,854 | $1,264 | 5.16% | $50,573 |
| Corpus Christi, TX | 326,586 | $1,102 | -7.68% | $44,069 |
| El Paso, TX | 681,728 | $1,100 | 0.96% | $44,010 |
| Wichita, KS | 389,938 | $719 | 24.74% | $28,741 |
Methodology
Rental data was pulled from Apartment Guide’s multifamily rental property inventory for one- and two-bedroom units over July 2022 and July 2021. A single measure of price for all unit types per time period was calculated using a weighted average based on the number of available units. The top 50 cities by population in our analysis were determined by current U.S. Census Bureau population estimates.
The rent information included in this article is used for illustrative purposes only. The data contained herein do not constitute financial advice or a pricing guarantee for any apartment.